No description
This script loops through WI schools and computes the cycling route from each grid cell to school. These routes and grids are saved to rds objects to be analyzed in a separate script. |
||
|---|---|---|
| archive | ||
| docker | ||
| examples | ||
| html | ||
| other | ||
| R | ||
| .gitignore | ||
| cycling_route_analysis_brouter.Rmd | ||
| LICENSE | ||
| Makefile | ||
| README.md | ||
| route_analysis.Rmd | ||
| route_to_school.Rmd | ||
| WI-schools-cycle.Rmd | ||
Routes for walking to school
This script generates maps to analyze the potential walking routes for students to their school.
- I excluded the addresses of the students from the repository.
- The actual route generation is done with
brouter(using the safety profile) andOSRM(for the boundary polygons), those are run locally in docker containers. - The basemap is pulled from Stadia Maps. The usage of the script is well within the free tier, you'll need an API key from them.
Data sources
- School location data is from: https://data-wi-dpi.opendata.arcgis.com/
- Madison Bike Level of Traffic Stress is from: https://data-cityofmadison.opendata.arcgis.com/datasets/cityofmadison::bike-lts/explore
- Student addresses provided by school.
Example figures
This script will generate a few figures:
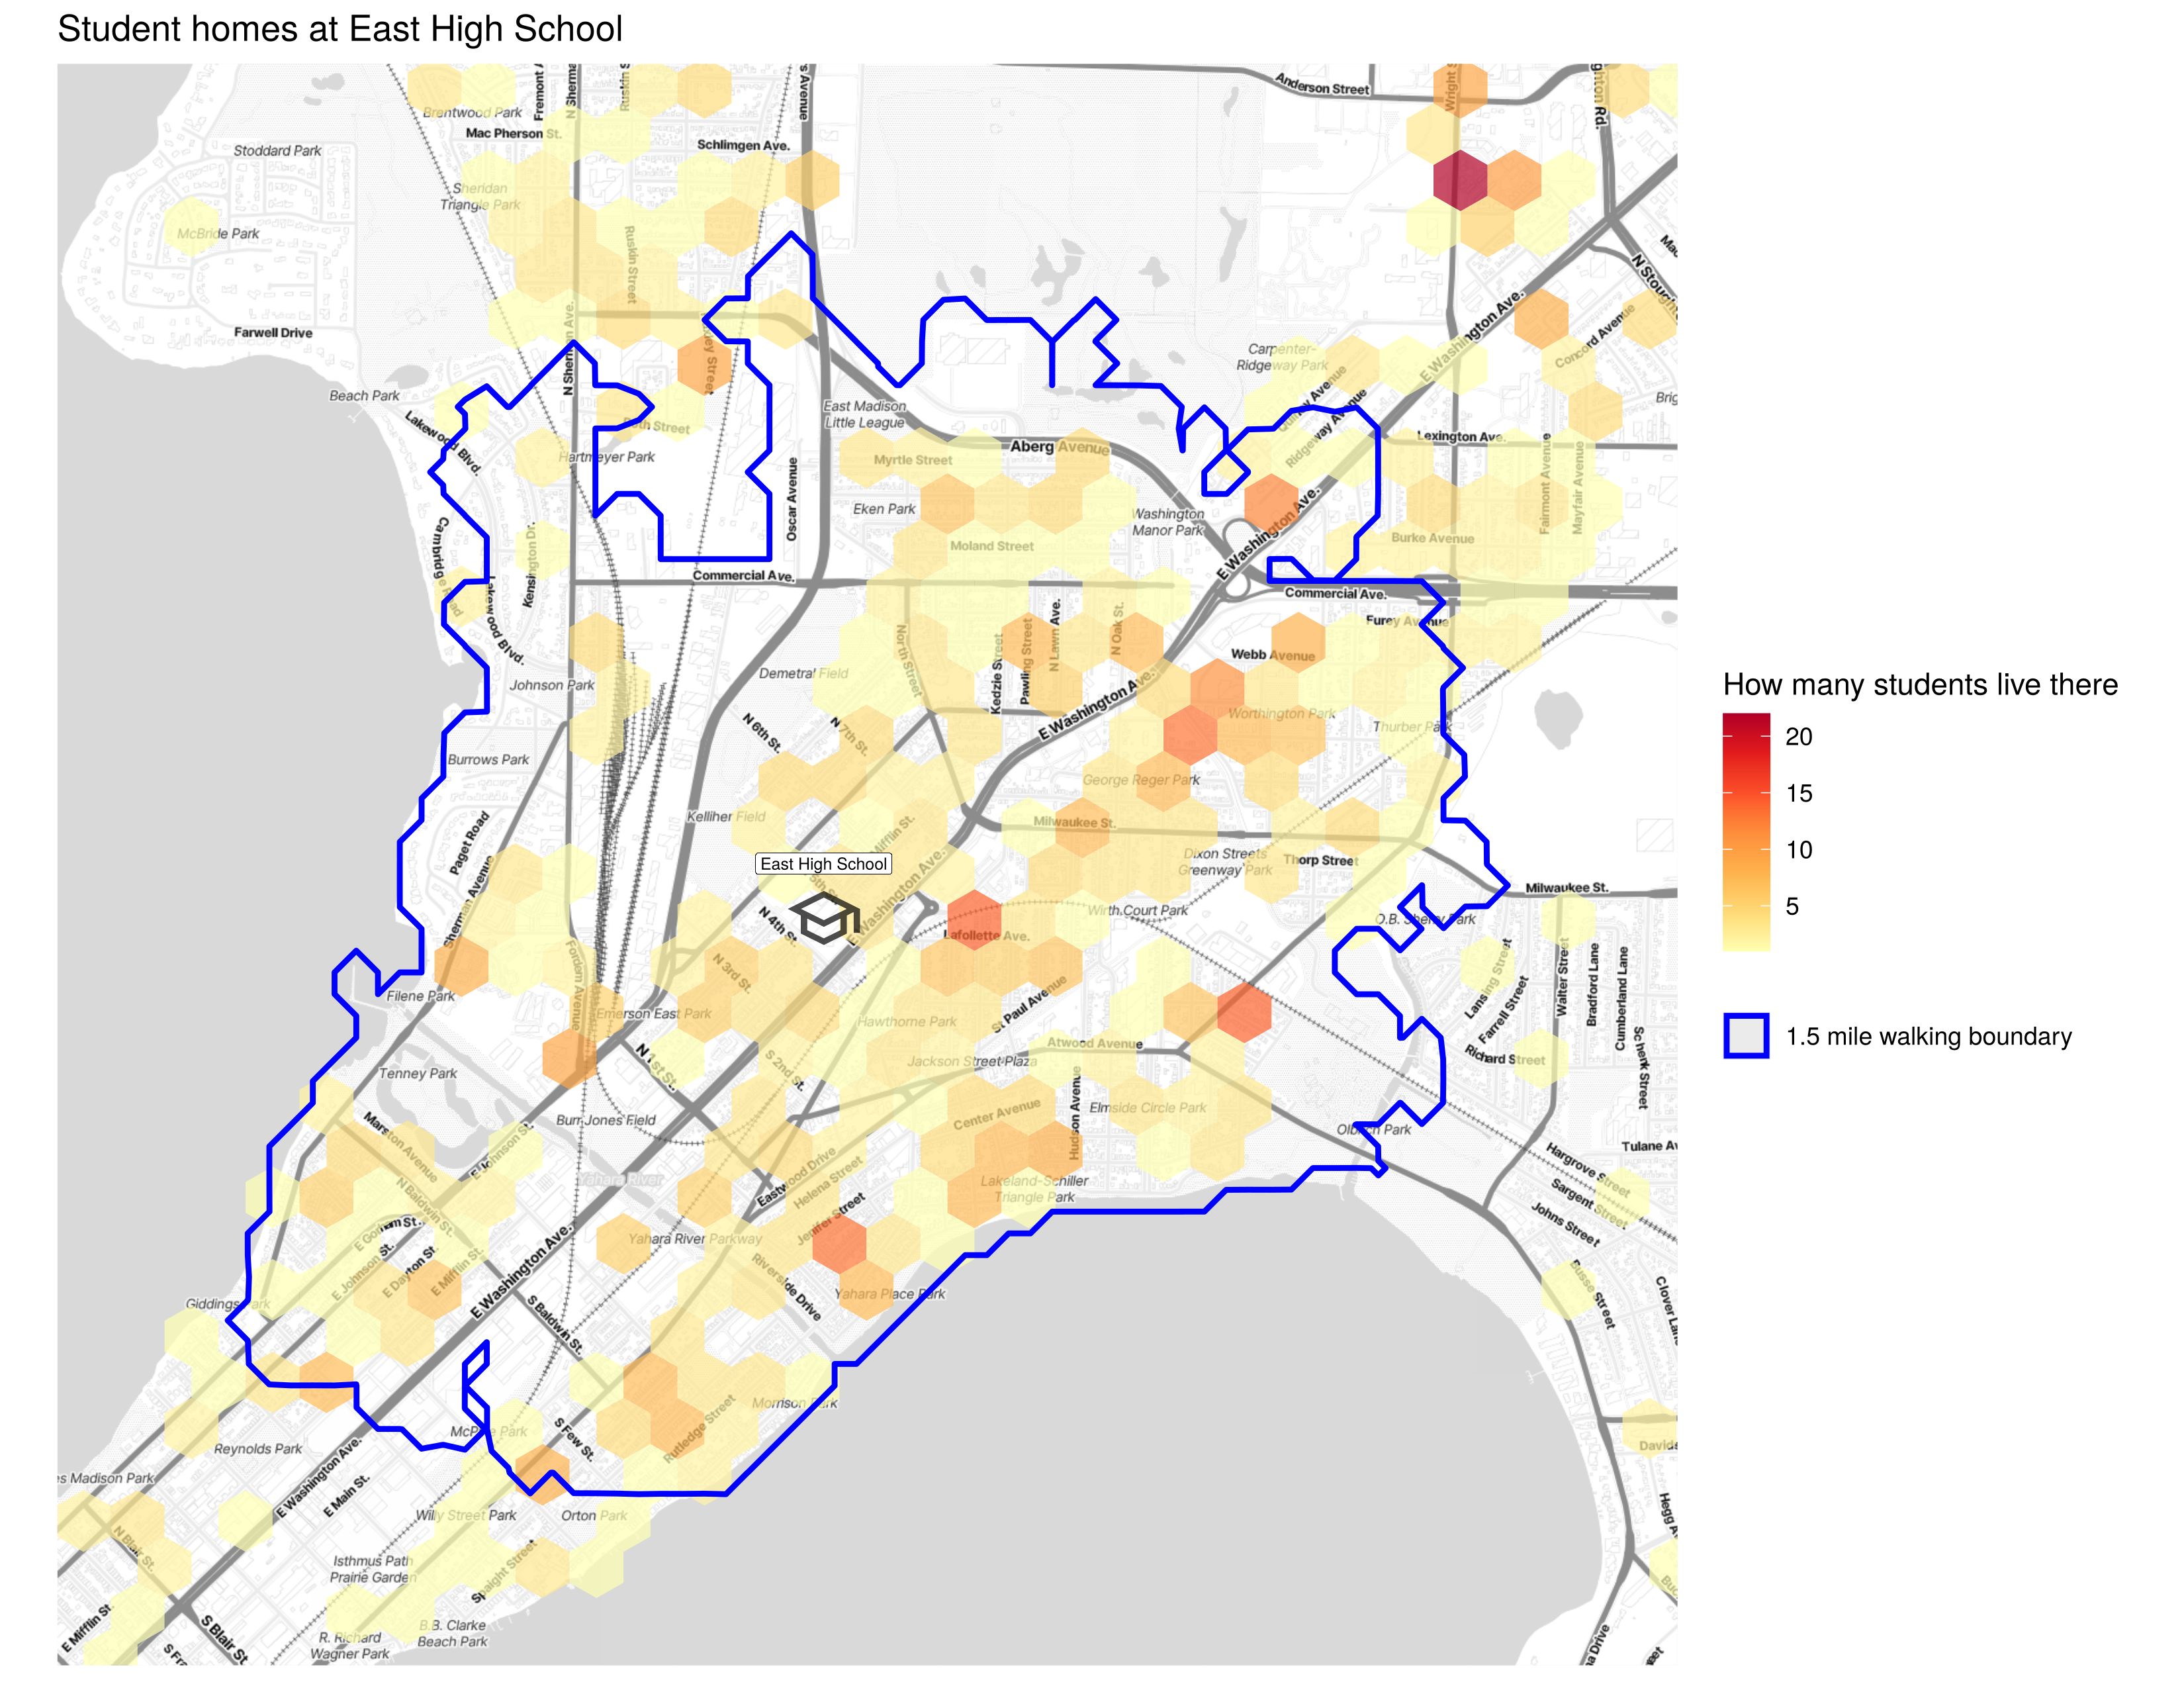
A heatmap of student addresses:
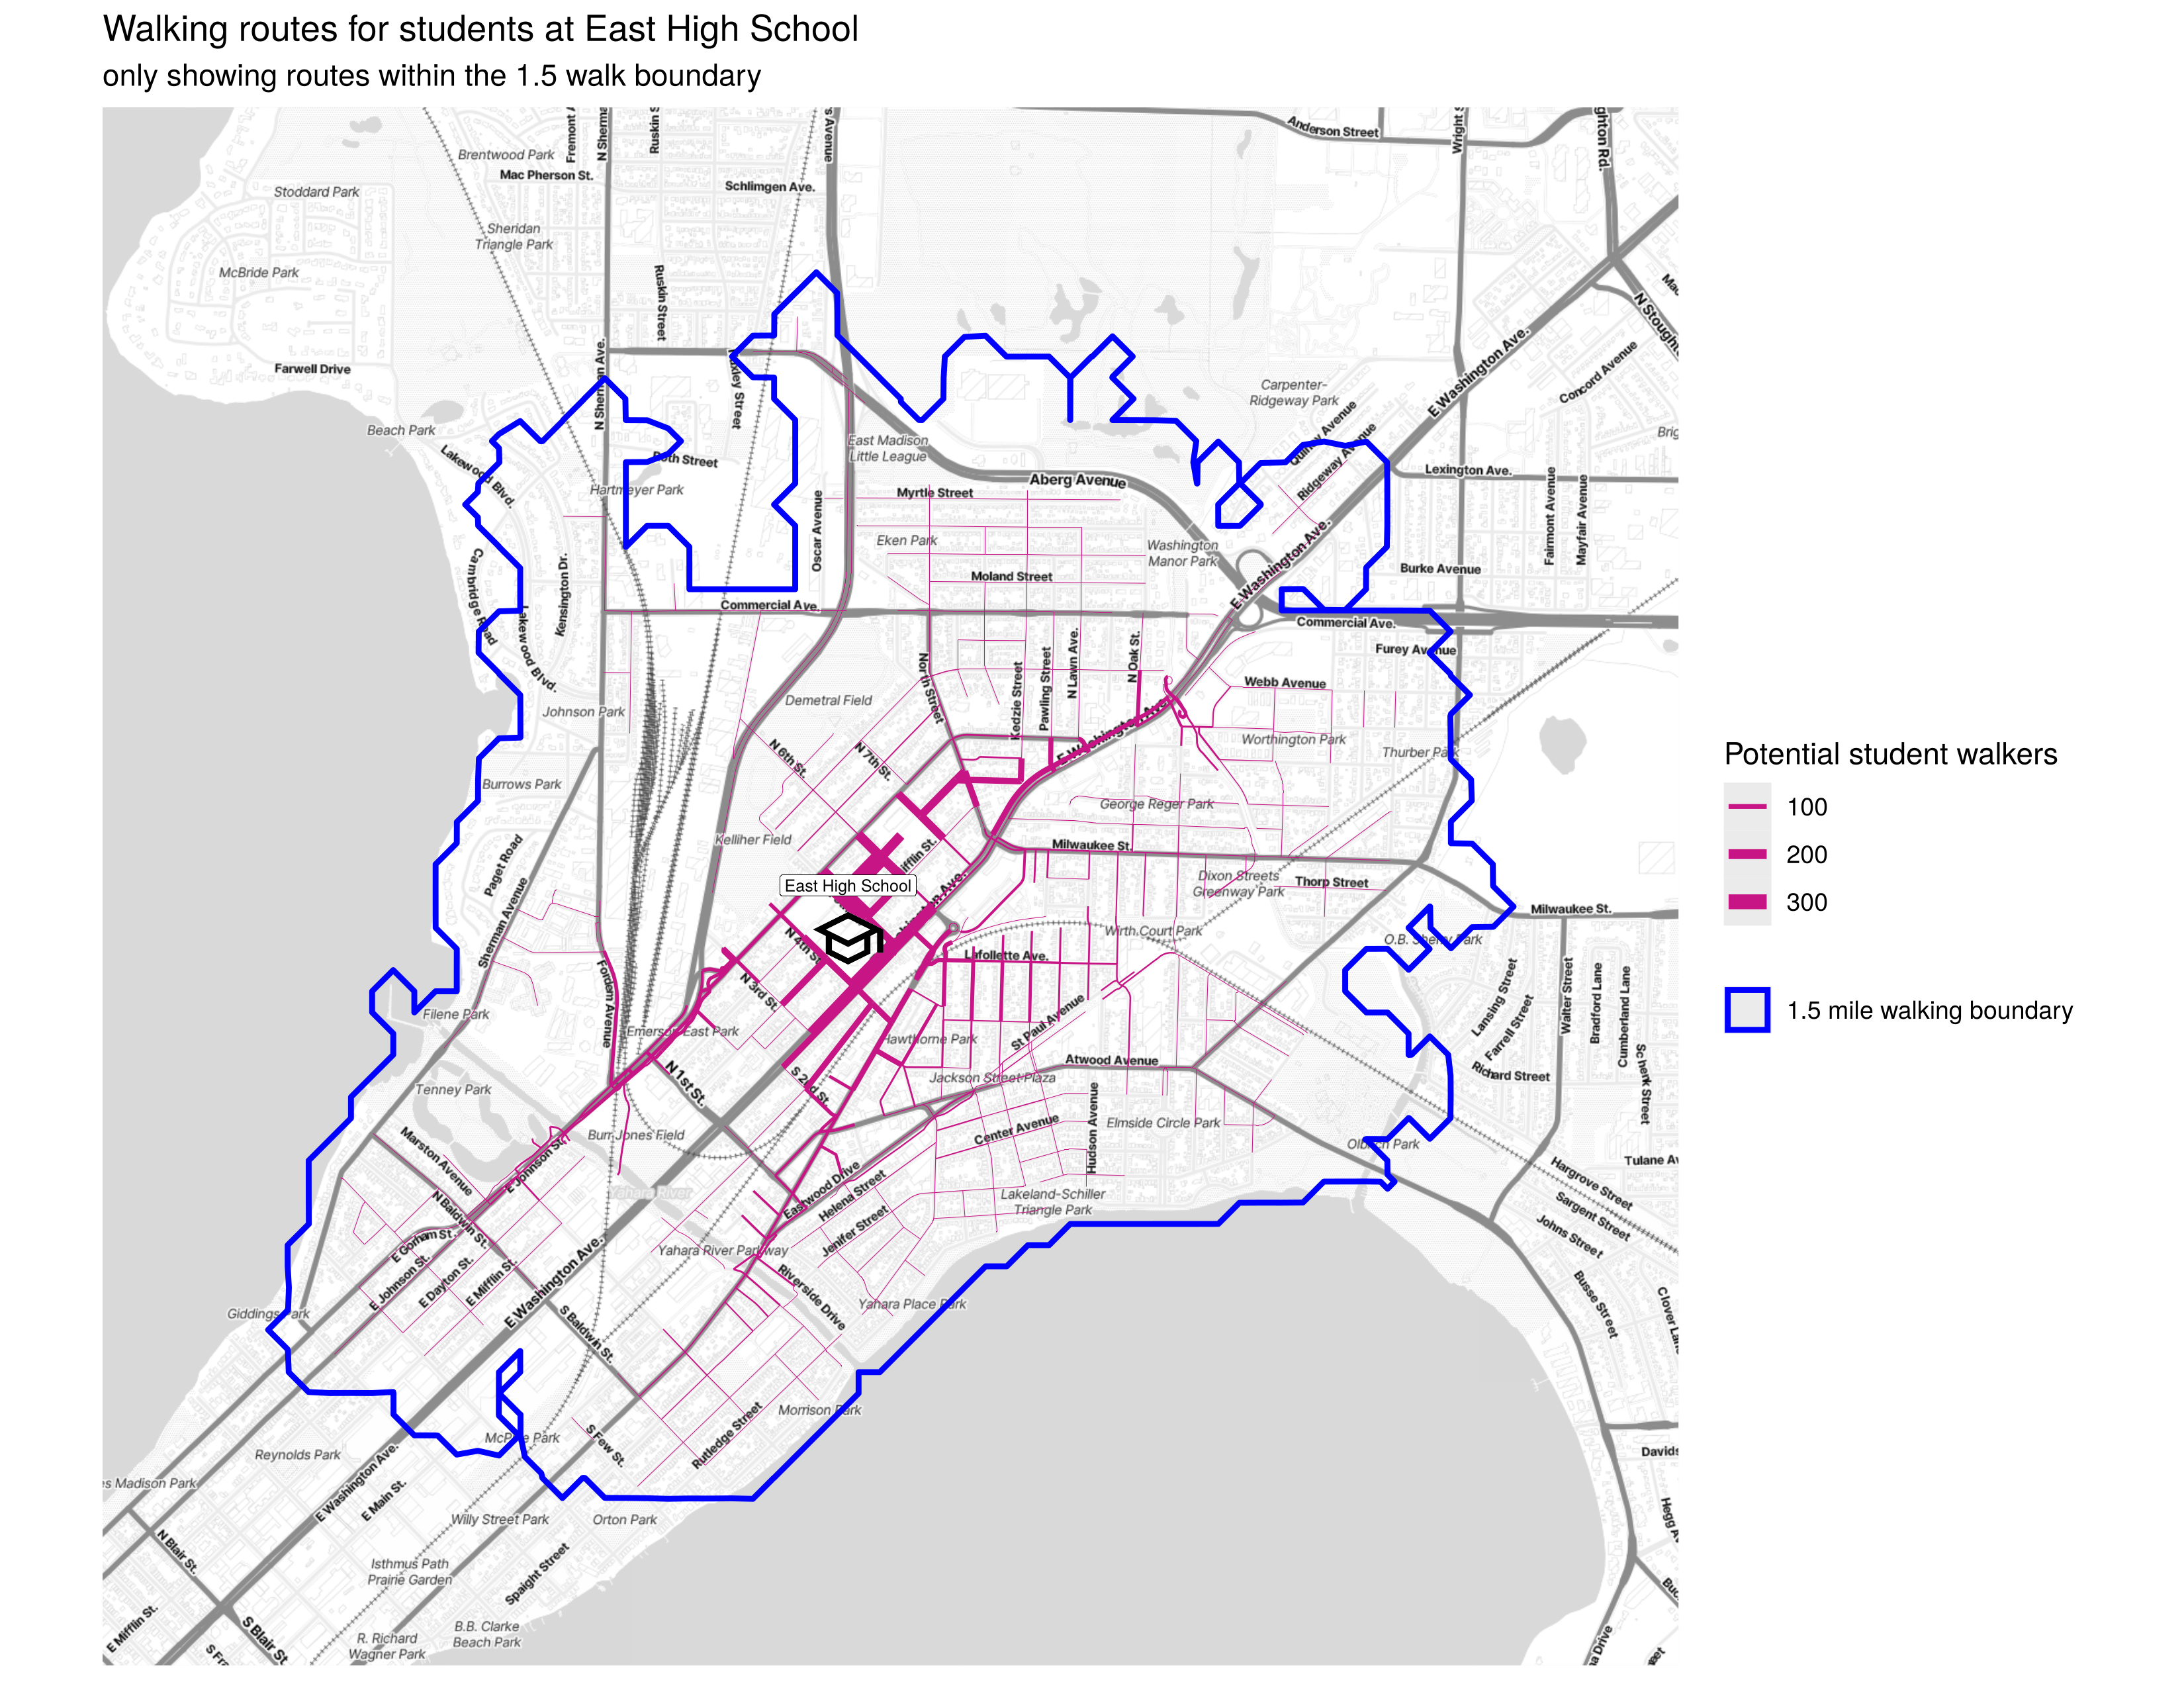
A map of all the walking routes within the walk boundary:
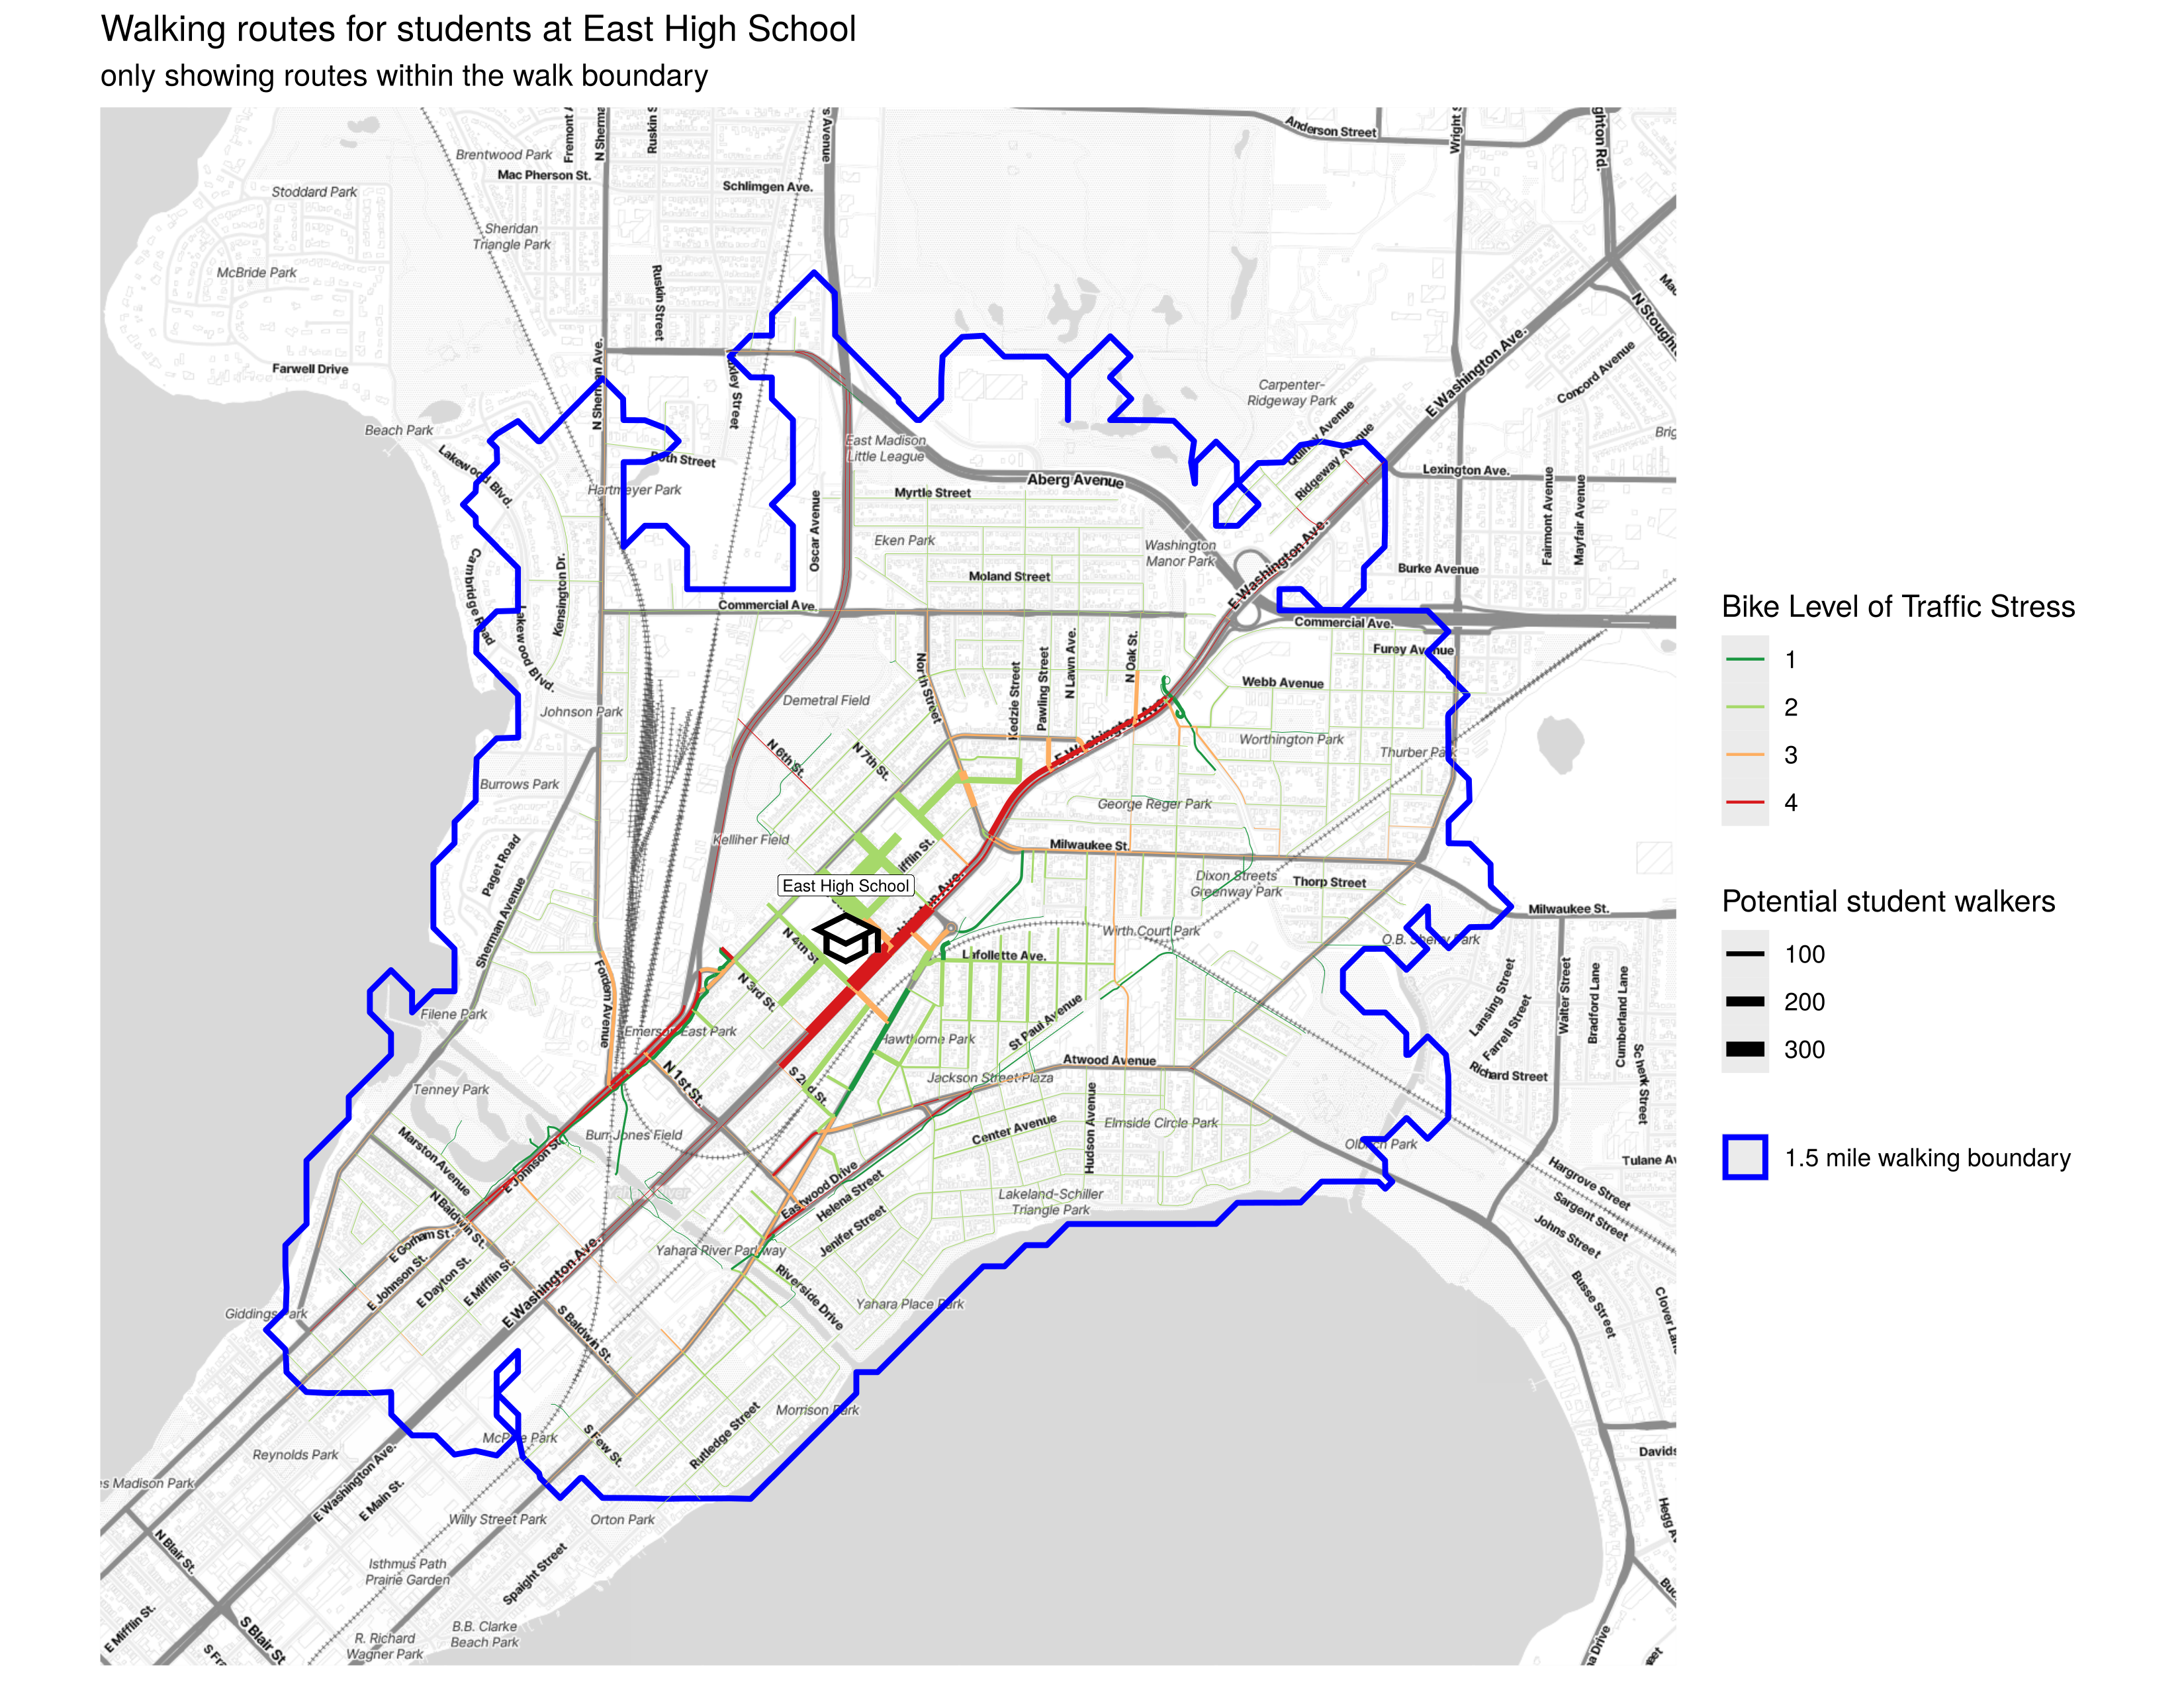
A map of those walking routes colored by the level of traffic stress to bike
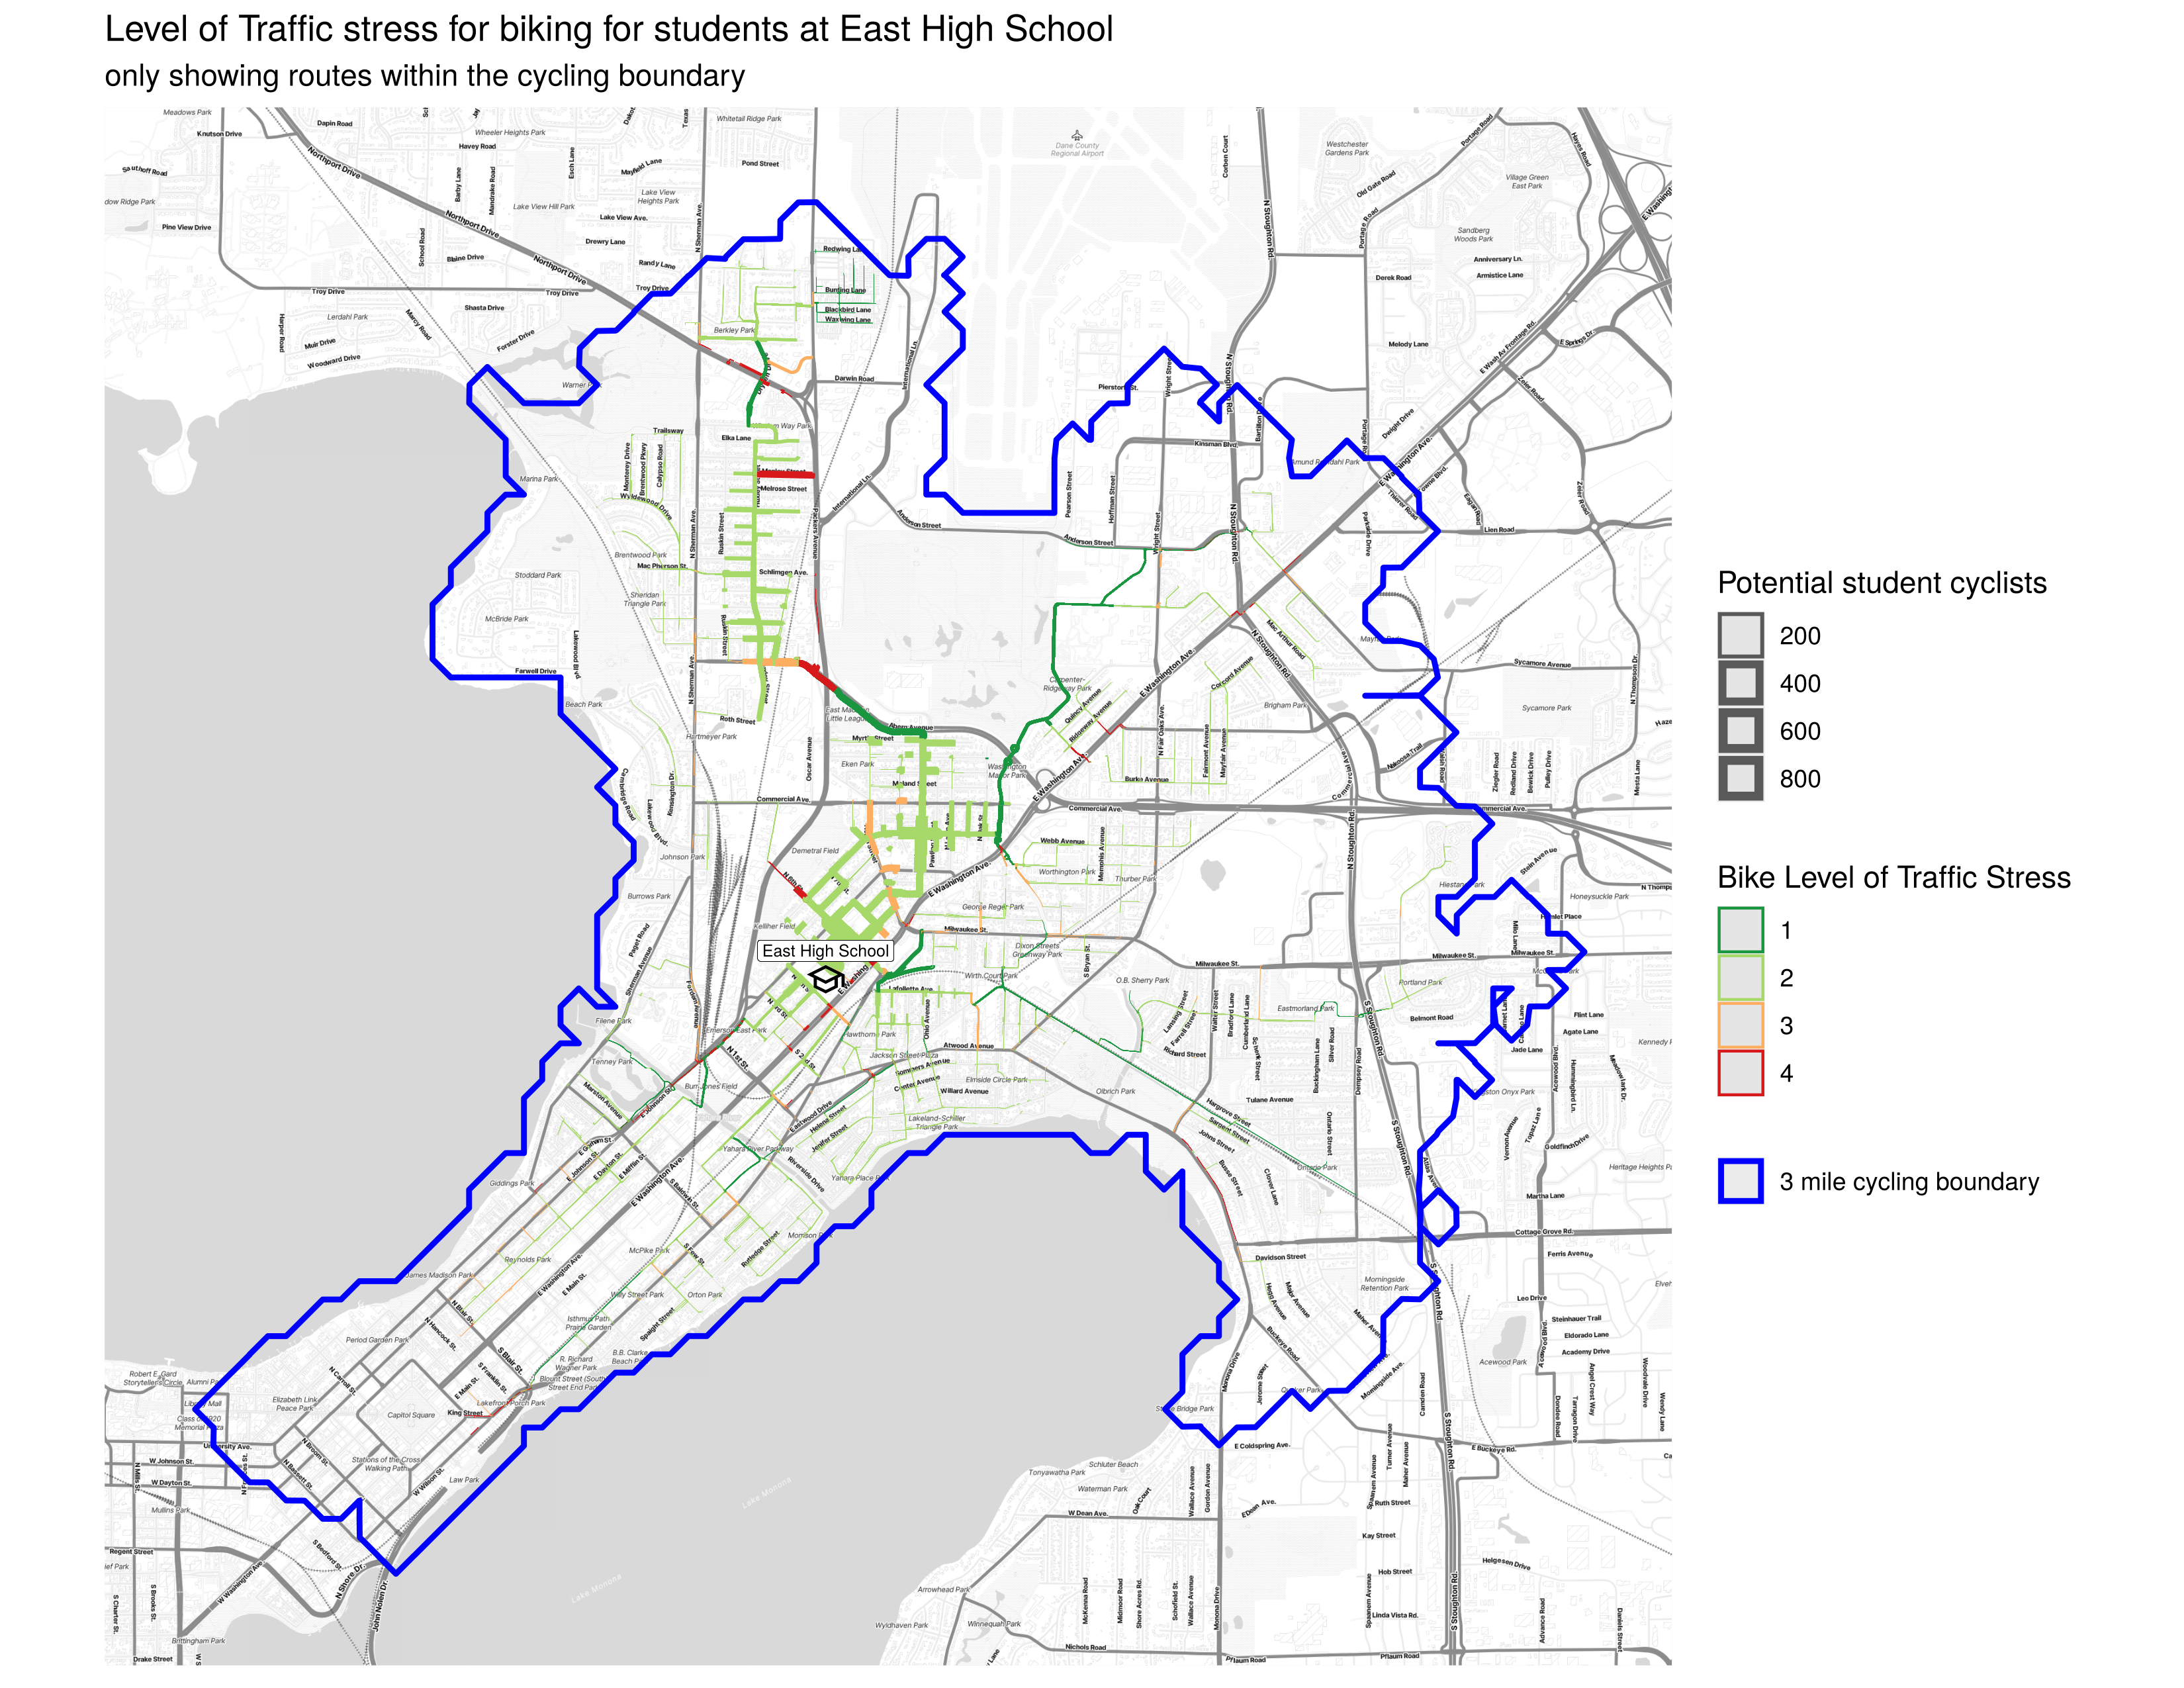
A map of cycling routes colored by the level of traffic stress to bike (with a 3 mile radius)
Using make
make osrm-data: downloads the OpenStreetMap data for Wisconsin, and preproccesses it for use with OSRM.make osrm-container: starts the OSRM containers (backends and frontends) for walking and biking.make brouter-data: clones the repositories for brouter and brouter-web and downloads the segment data. It also builds the docker images for brouter and brouter-web.make brouter-container: starts the brouter containers (backend and frontend).make walkwill run route_analysis.Rmd which calculates the walking routes using OSRM.make cycle-osrmwill run cycling_route_analysis.Rmd which calculates the biking routes using OSRM.make cycle-brouterwill run cycling_route_analysis_brouter.Rmd which calculates the biking routes using brouter.