599 B
599 B
USGS NWIS data visualizations
Gets river discharge data from the USGS NWIS and makes visualizations
To run :
- Clone the repository
- Change the working directory in line 6 of
USGS_NWIS.R. The script will make thedataandfiguresdirectory in the working directory. 10 rivers will generate ~100MB of total data and figures. - Edit the list of rivers and their respective site IDs in
river_IDs.csv - Run the script. The intitial download of the data will take some time. Subsequent runs will just download new data.
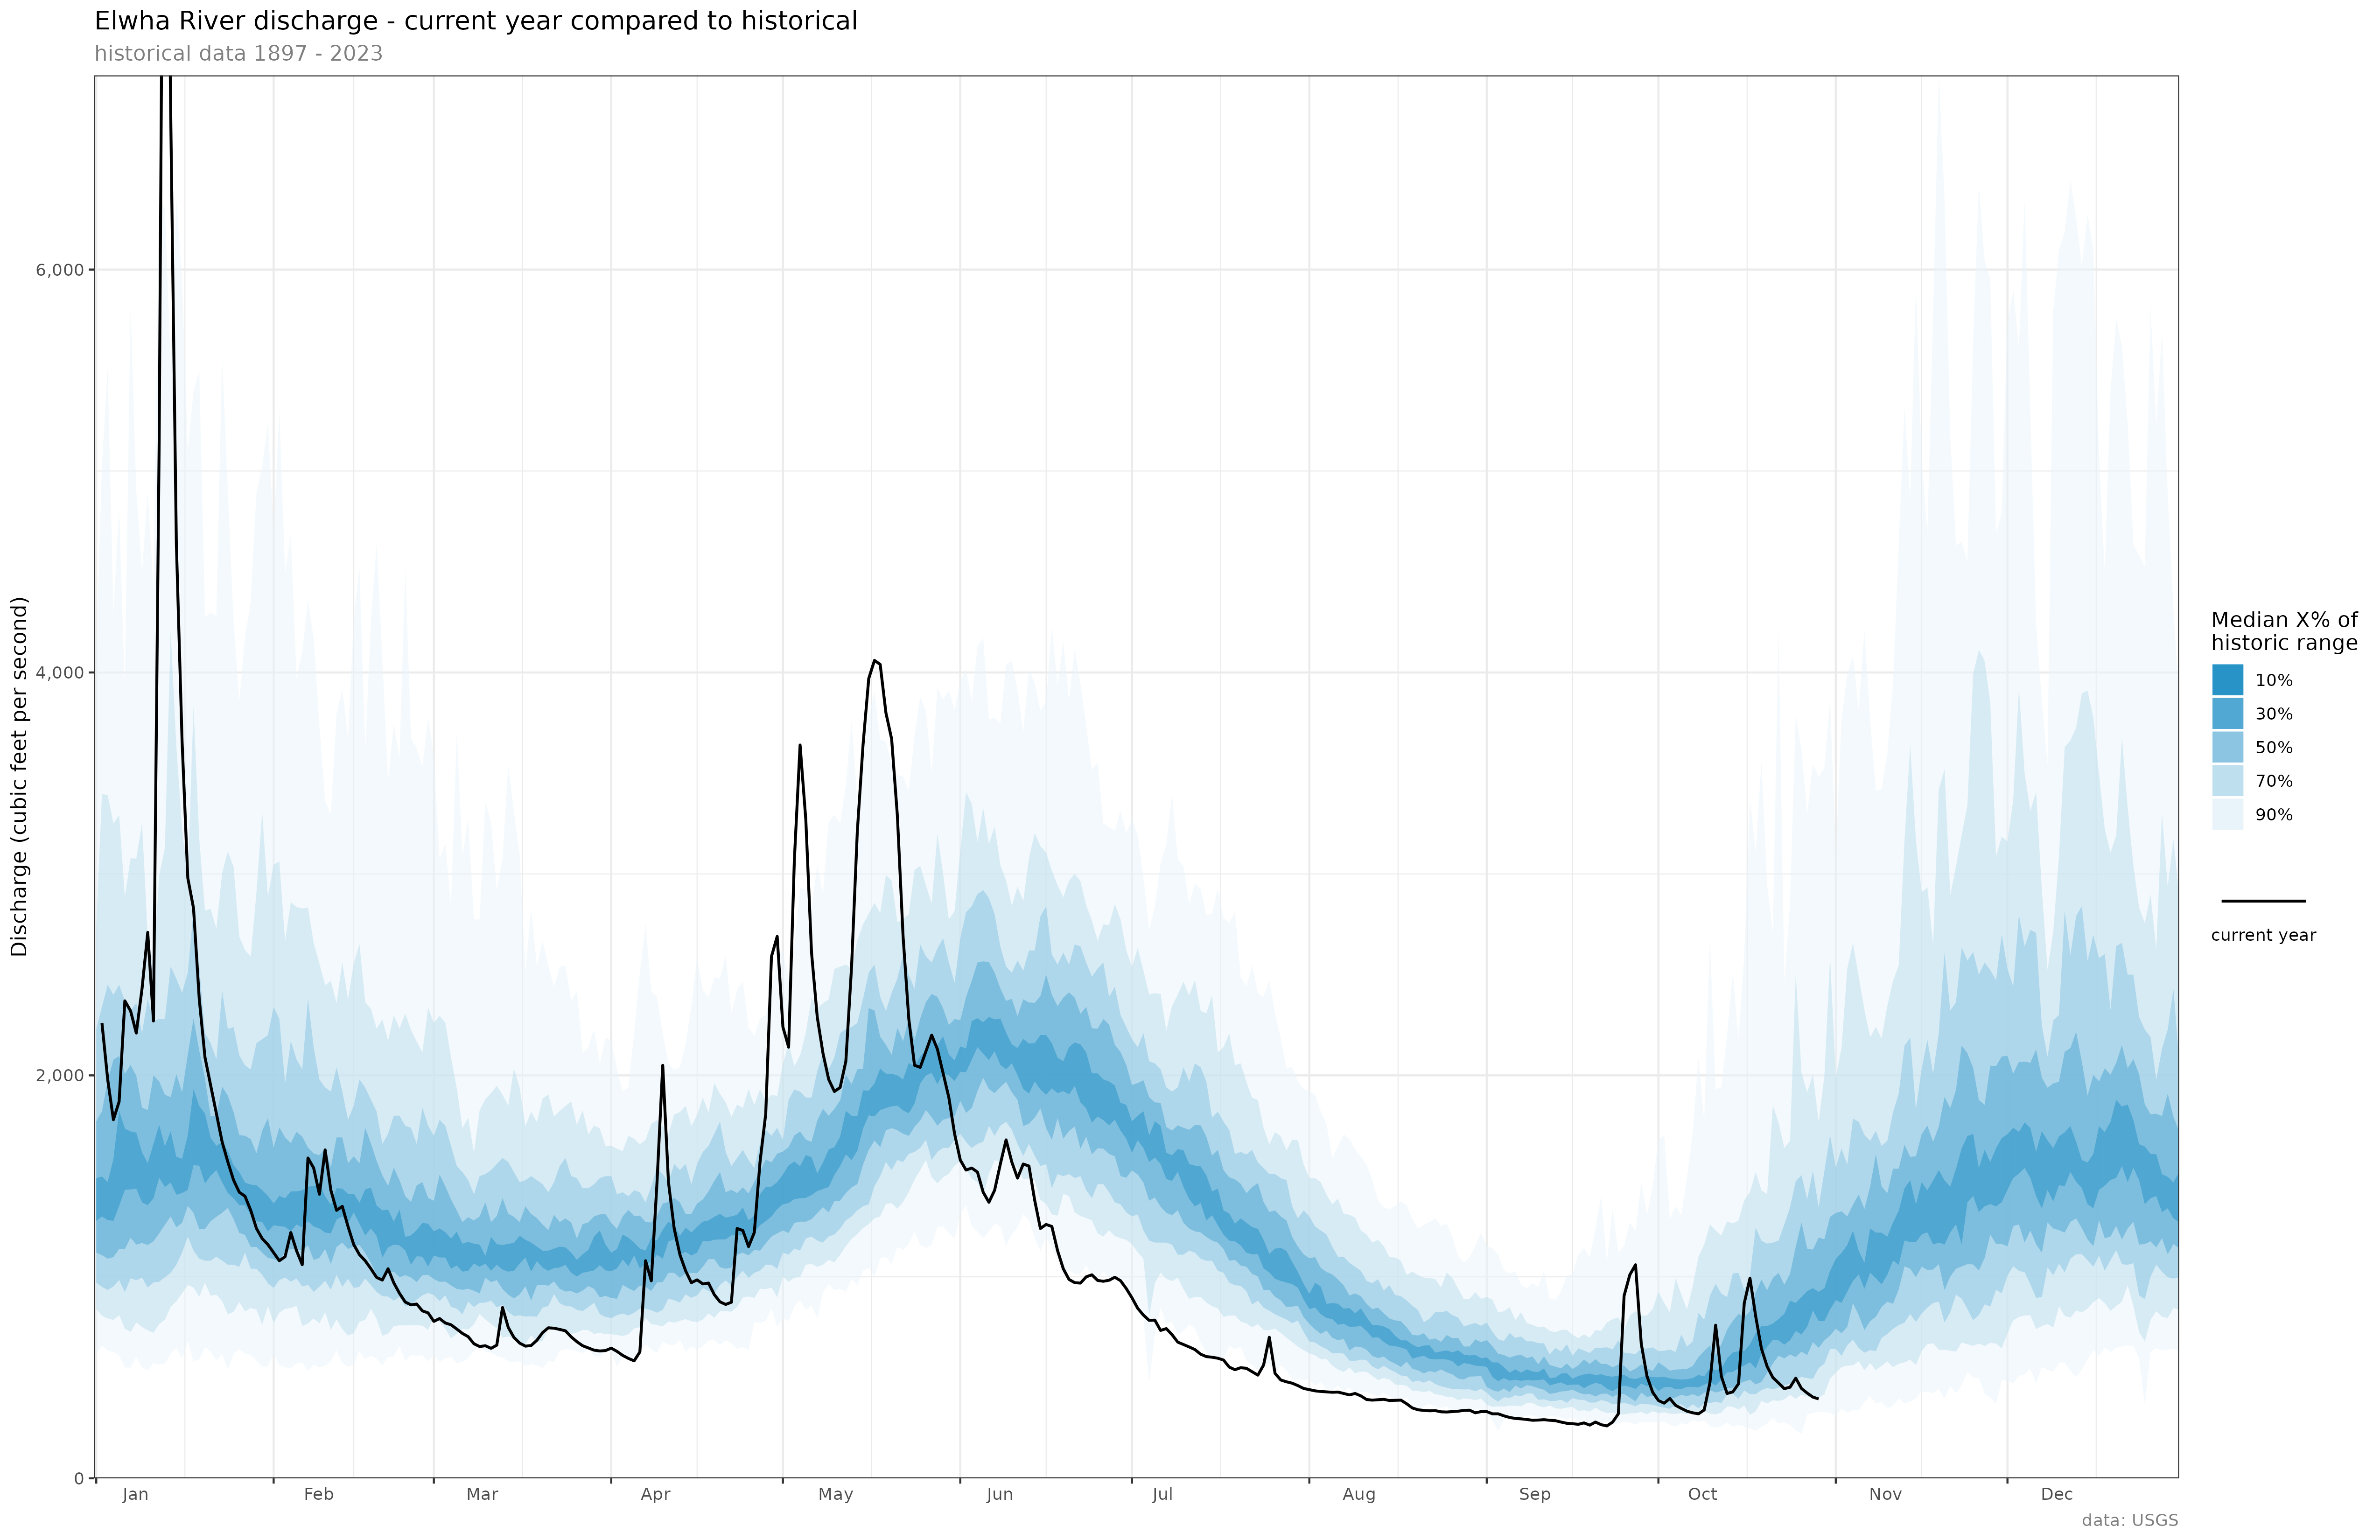
Example figure