757 B
757 B
+++ date = '2024-10-14T19:13:18Z' title = 'River Level Charts' +++
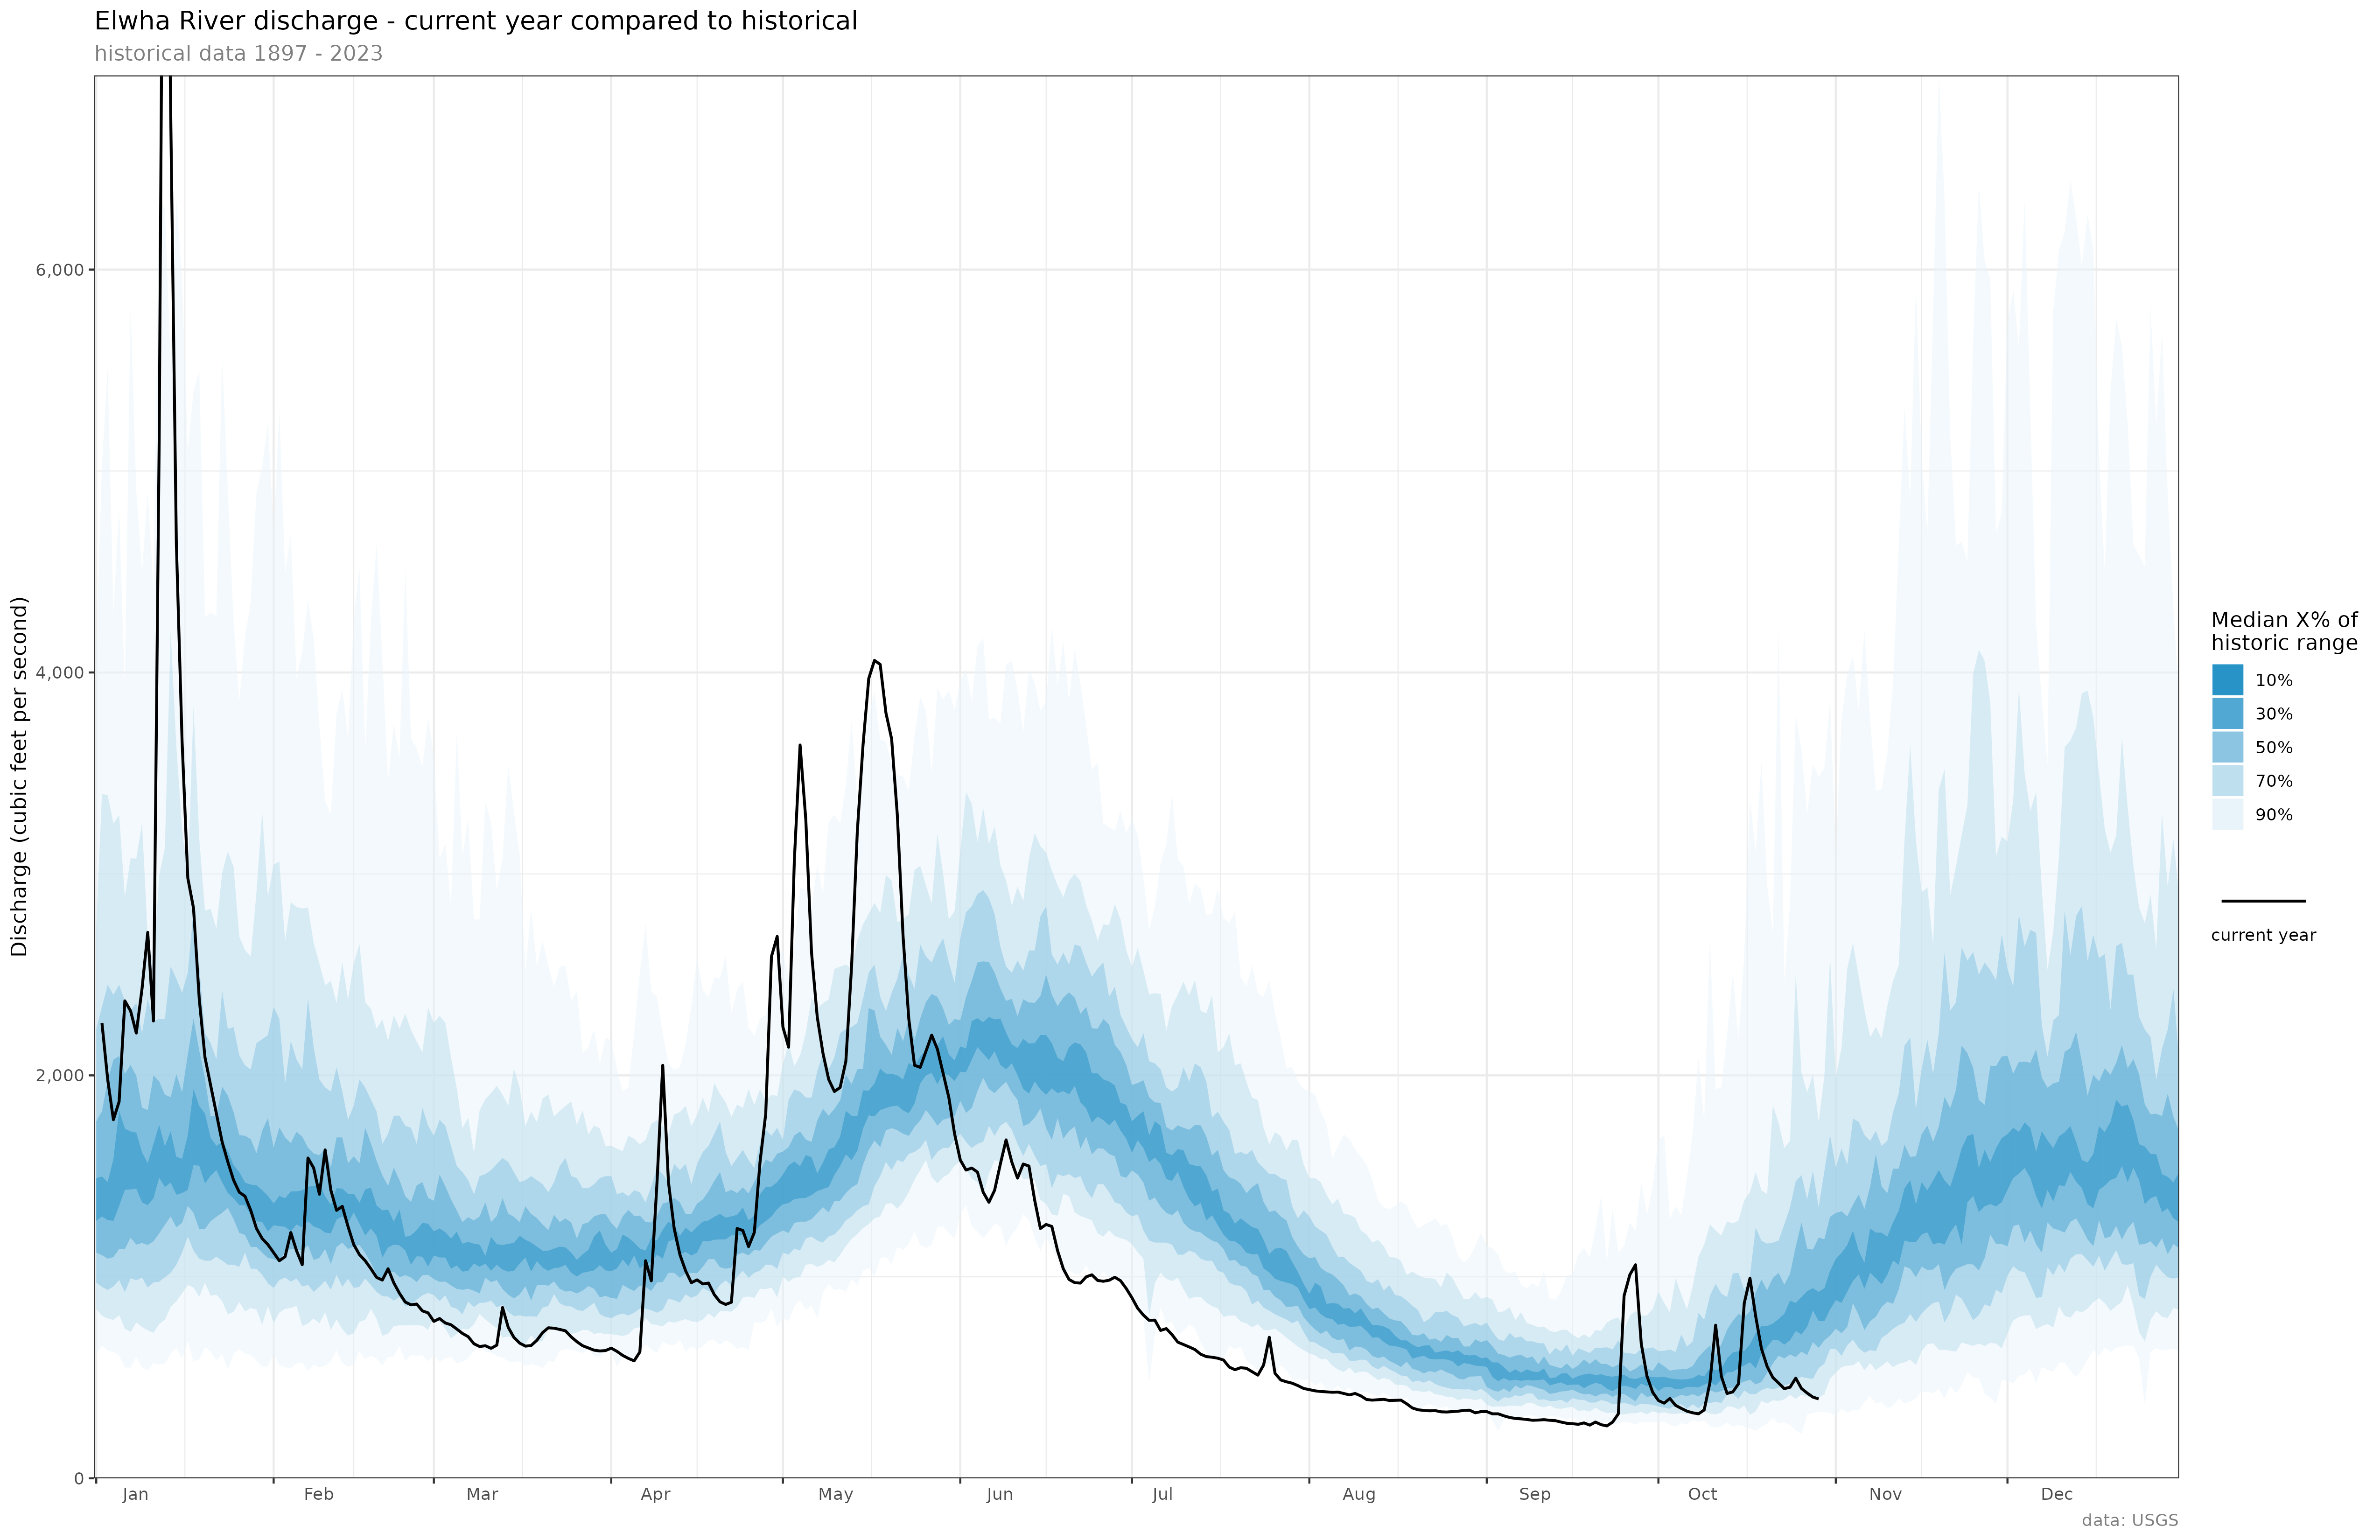
I'm interested in rivers (both ecologically and recreationally) and I want to know water level they are currently at, and how does that compare to their water levels throughout the year and in their recent history. In the US, the United States Geologic Survey (USGS) maintains a large set of realtime water level sensors, and that dataset is queriable through an API. So I wrote these scripts that take a set of rivers and their associated gauge IDs, downloads the recent and historical data and generates a bunch of graphs.
Here's the code: https://git.dendroalsia.net/ben/USGS_NWIS